DNS Tunneling Detection Lab
Objective: understand DNS tunneling behaviour in an isolated VMware lab, capture PCAP evidence with Wireshark, analyse query patterns, and build detection logic using entropy, query length, timing, and repeated domain behaviour. Every packet below is from the controlled lab environment. This project is for defensive learning only.
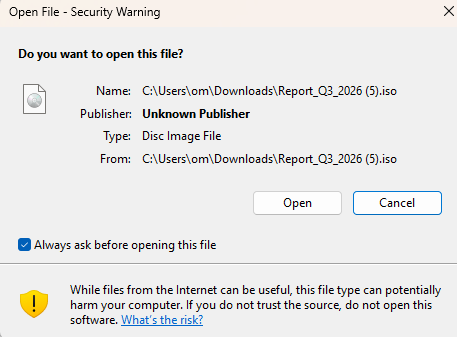
Lab context
A standard Windows "Open File" dialog during the controlled lab setup. This exercise focused on traffic analysis and detection logic, not operational misuse.
Network topology
The lab setup: two machines on an isolated network. The client host (left) is a Windows 11 VM used to generate DNS traffic patterns. The analysis host (right) captures DNS requests on port 53 for PCAP review and detection rule development.
Packet timeline
Every dot is a single DNS request captured from the network. Green dots are normal Windows traffic (Bing, Microsoft updates). Red dots are tunnel-pattern DNS queries used for detection analysis. Notice the tight burst of red dots around the 17 to 20 second mark, where encoded data was sent in rapid DNS queries. Higher on the chart = more random-looking = more suspicious. Press play to replay the capture.
Randomness analysis: how defenders catch this
This is the defensive perspective. Normal website names like "www" or "assets" are readable English with low randomness. The tunnel traffic uses encoded data that looks like keyboard mashing ("emqeg33qpfzgsz3i..."), which scores much higher. A security team doesn't need to decode the data. They just measure how random each domain name looks (called Shannon entropy). If it's consistently above ~3.5, something is hiding data in DNS.
~4.0 on the randomness scale vs ~1.8 for normal traffic, more than double. Combined with the fact that every tunnel domain is exactly 45 characters long, they all arrive in rapid 110ms bursts, and none of them ever repeat (normal DNS gets cached and reused), a monitoring tool would flag this within seconds.
Packet inspector
Raw log of every DNS packet from the capture. Red rows are tunnel-pattern traffic flagged for analysis. Yellow rows are END signals sent three times to mark transfer completion in the lab. The "Entropy" column shows the randomness score for each domain name. Higher values stand out as suspicious.
| # | Time | Dir | Source | Dest | Domain | Type | Randomness |
|---|